 Almost every gamer has seen Lou Zocchi’s classic pitch for GameScience dice, and if you haven’t yet and have the 20 minutes, click that link. It’s worth a watch. About 4 minutes into the first video, Zocchi references his picture of stacked dice, seen to the right. This picture has long been the major piece of proof that GameScience fans point to as proof of the superiority of their favorite dice. We can date that picture between 1981 and 1991 because the far left stack of dice comes from the Red Box DnD Basic set, only two editions of which were published. The Moldvay Edition was printed from 1981 to 1983 and the Mentzer edition was printed from 1983 to 1991. That means that this evidence is between two to three decades old.
Thus, there are several major reasons for us to question this evidence:
- Age — Even given that this picture was ironclad evidence 20-30 years ago, many things may have changed in the intervening decades.
- Lack of Scientific Merit — A picture is fun anecdotal evidence, but it’s just that – anecdotal and not scientific.
- Bias — I’m not about to impugn the reputation of Mr. Zocchi but we would be remiss to accept the word of a business owner and salesman without fact checking first.
Enter Alan DeSmet and his wife Eva, who decided to replicate the famous picture with modern dice purchased at Gen Con 2009 directly from the dealer booths of Chessex, GameScience, Crystal Caste and Koplow. Alan’s article can be found at his brand new RPG blog 1000d4 and you should go read it to get the full gist, though I will sum it up here before beginning my analysis of his data:
Eva purchased the dice in 2009, directly from each company’s booth at Gen Con. She attempted to get an assortment of colors to avoid bias from a single batch of dice. Eva told each company about our plans to measure the dice and asked if there were particular dice they wanted us to use. They uniformly said to choose whichever dice she liked. The GameScience staff reminded her to stack them on the side with the flashing as well.
The dice are unmodified and have not been subjected to significant wear and tear since their purchase. We have not used them for any games. They spent most of their life sitting in plastic baggies in a storage tub on a shelf. We left the flashing on the GameScience dice.
With these dice, they duplicated Zocchi’s earlier photograph with similar but far less dramatic results (click through go to DeSmet’s article where a huge version is featured):
Note that there is one fewer Chessex translucent die so that’s why those stacks are so much shorter.
Being scientifically minded however, they were unsatisfied with simply providing a snapshot. Instead they measured every face of every die with a digital caliper and calculated several statistics from their data.
For each die they computed the difference between the largest and smallest axis, a statistic they called Delta and then reported the minimum, maximum, average, and standard deviations of these deltas for each manufacturer.
They also calculated the standard deviation of the widths of each die face across each manufacturer and then found the maximum face standard deviation per manufacturer as a test of consistency.
In addition, they made their data set available online, so I downloaded it and ran some analysis of my own.
For my analysis I was interested in the following 3 hypotheses:
- The average axis length across all styles of dice is the same.
- The Delta score (max difference between two axes) across all styles is the same.
- The Standard Deviation across die faces is the same across all styles.
To perform this analysis I ran a series of One-Way ANOVA tests using the statistic of interest as the dependent variable and manufacturer/style info as the independent variable.
First, my analysis returned some descriptive statistics. These are similar to the ones provided in the original article but aren’t exactly the same because they’re grouped differently.
Note that Crystal Caste Metal has no standard deviations because it has a sample size of 1. (and at the price of them, we’re lucky we got the one in our data set)
Next, my analysis gave p-values for each of the above hypotheses. A p-value is the probability of observing the sample we did IF our hypothesis is true. In all three cases, the p-value was <.0001. That means that IF it’s true that the average axis length across all styles of dice is the same (my first hypothesis) that the probability of observing a sample as unrepresentative of that as what we saw is less than a 1 in 10,000 chance. That’s like rolling a 0,0,0,0 on four ten sided die. Thus evidence very strongly rejects my three initial hypotheses.
However, Just because not all of the dice are the same, does not mean that all of the dice are different. To estimate which dice are similar and dissimilar, I rand some post-hoc analysis (analysis done after the initial ANOVA) and produced several easy to read graphs (as well as several huge boring tables of numbers that no one wants to see.)
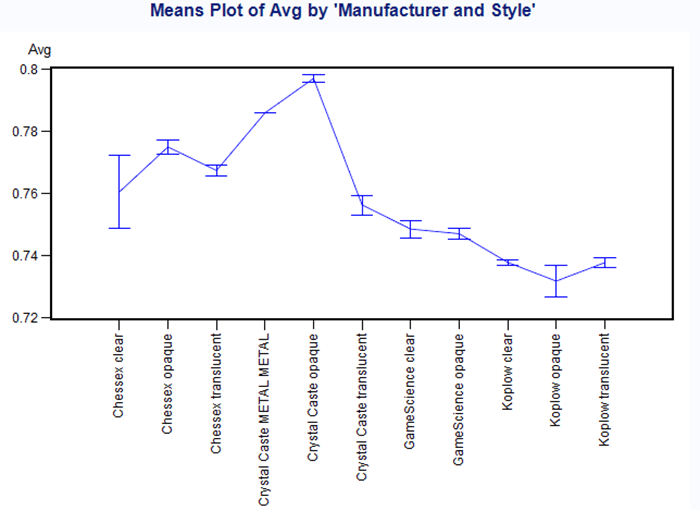
The plot of Average axis length by manufacturer and style is a comparison of the size of the dice. A die with a large average axis length is bigger than one with a small average axis length. However, the bounds of each estimate (shown by the top and bottom bars of the “I” for each style) also tell us about how consistent size is within each manufacturer and style.
So this graph shows us that Crystal Caste opaque dice are the largest dice, while Koplow opaque are the smallest with various ranks in between. It also shows us that Chessex clear have the most variation in size and Koplow opaque have the next most variation in size, while Koplow clear have the least (we’re ignoring the fact Crystal Caste Metal appears to have no variation in size. That’s an artifact of it’s sample size of one). Note however, that all of these size differences are within a range of 8 hundredths of an inch, so unless you’re planning on a marathon dice stacking session in which consistently sized dice are a must, these differences are of little practical value.
Next we have a similar graph showing standard deviations of axis size across manufacturer and style. Here we see a set of three clear “strata” of dice.
Crystal Caste translucent dice have not only the highest overall standard deviation of axis length, but the variation within their axis length is also the largest, making them the overall least consistent dice. Aside from Crystal Caste translucent it looks like the rest of the dice fall into two categories. All styles of Chessex dice and Crystal Caste metal and opaque fall into the higher standard deviation set. GameScience and Koplow dice fall into the lower standard deviation set. It’s worth noting that while Koplow opaque dice fall into the lower standard deviation category, those big boring tables that I didn’t include do show that Koplow opaque has a statistically significant higher standard deviation than either style of GameScience Dice. Like the mean axis lengths, the range over which these standard deviations is small (in this case within 14 thousands of an inch) but it’s more difficult to dismiss these differences as not of practical importance since we don’t know how these small inconsistencies in axis length within a single die will effect the way it rolls.
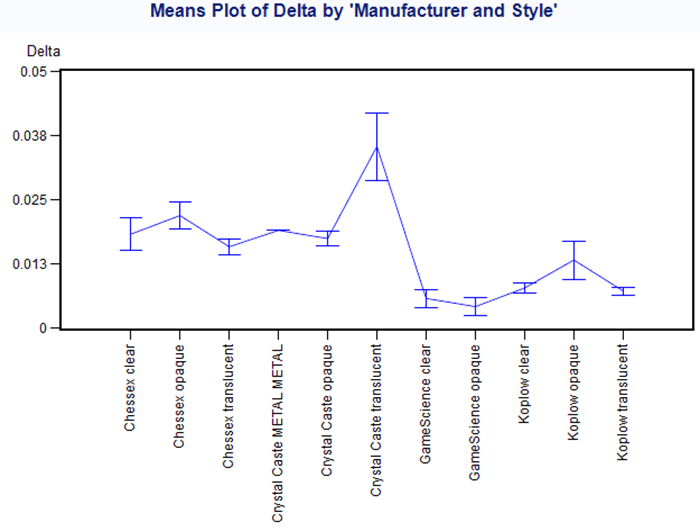
Finally we have a similar graph comparing delta statistics across manufacturer and style. Remember delta is the difference between the largest and smallest axis length on a die.
This graph looks almost the same as the standard deviation plot, with Crystal Caste translucent having the greatest deltas and greatest range of deltas, and the rest of the dice being split into two groups. However in this case, Koplow opaque “bridges” the two groups even more than it did with respect to standard deviation. The tables show it matches Chessex clear and translucent, and Crystal Caste opaque from the high delta group and only Koplow clear from the low delta group. Again, these results fall within a range of 5 hundredths of an inch so practical value is hard to determine.
My final conclusion is that Crystal Caste translucent dice are clearly the least consistent dice, Chessex and other styles of Crystal Caste appear to be more consistent than Crystal Caste translucent but less consistent than GameScience and Koplow dice, with Koplow opaque dice representing a “middle of the road” option.














I’m not sure what this has to do with GMing, but it was really interesting to see the data an analysis. This is just the stacking data, correct? At no time were rolls recorded and analyzed.
It would be a general wast of time, but I want to see the Game Science dice rolls vs competition as well as the roll time. The flat edges by Game Science are part of the pitch. If there is true evidence that the Game Science dice roll more randomly, or that other dice roll less randomly, it would give some merit to a a few of the guys I gamed with during college who argued about borrowing a set of pink dice I have because they “rolled better” than the other dice.
Think of it as a tool to help you decide between various options available in the market, similar to a book review.
There is no roll data in the data set. I know ultimately they want to create some roll data, but I’m not sure what their timetable for it is. Maybe if we apply some peer pressure…
Once they provide a roll data set I will definately be analysing it.
Roll time data would be very interesting, but it would probably require specialized equipment to gather so we may never see it.
Roll randomness would be very interesting to me, as well. When I watched the video of his pitch the first time, I kept waiting for him to get to the part where he’d analyzed a bunch of rolls, and found some statistically significant variation between rolls on his competitors’ dice… He never did, though…
Measurements are great, but if you (Lou Zocchi) can’t prove to me that those numbers are a problem, then I will continue to be unconvinced.
Very interesting analysis, though… I think I even understood most of it.
“Words words words words”
*chuckles*
In all seriousness, I am peripherally interested, even if I don’t understand a whit of what was said.
As an aside, I was at GenCon ’87-’93 or so 4 times, and I recall seeing that photo myself, though I have a vague recollection of seeing an actual angled box with dice in it.
I imagine some people with more GenCon experience than I, and looking into the photographic record might better get a date on the photo, if that was of interest.
As for the true Randomness of a die, and as I recall, the ’20’ being opposite the ‘1’ – isn’t it possible that the ’20’ is more probably than the ‘1’ because of the larger amount of plastic present on the ‘1’ face, than the ’20’ face? [Presuming dice with grooved numbers] Yes, I realize this is such a small difference, but isn’t that in some ways what we are talking about with such miniscule die-inconsistencies? I guess the only way to fix that would be to compute the ‘lightest’ side, and design all sides to remove the same amount of plastic, either by thicker numbers, or adding a line under, or a circle around the actual number to make up the difference.
OK, I need to wake up more, that sounds ridiculous!
If anyone can narrow down the date on the photo, their comments are most welcome. From time to time Zocchi himself will drop in on these types of articles, so maybe we’ll be lucky and get a date straight from the source.
While I would agree with your intuitive reasoning for 20s to come up more that 1s, this article says it’s exactly the opposite, that the centrefugal force of the spin is more important that the weight and thus the difference in weight of the two sides actually has the opposite effect.
http://www.dakkadakka.com/wiki/en/That's_How_I_Roll_-_A_Scientific_Analysis_of_Dice
However, Casino dice get around this issue by re-filling their removed pips with plastic of the same density with a different color. They are more expensive for the higher quality however.
Matt, this may be my favorite article of all time on GS. Bravo!
(Seriously, I have a geek-gasm re-reading it every time.) 😀
I’m glad you like it so much! Really most of the credit goes to Alan and Eva for making their original data set available.
This is great. Like many of you, I have a magnifying light I use when painting minis. I kept looking at my dice in the magnifier while watching the video and reading the analysis.
Geeksplosion!
Hmm. Shouldn’t the conclusion, given the original impetus of the investigation (that the evidence LZ was using was “30 years old” and “anecdotal” ) be that LZ’s comments are born out despite the manufacturers in question having had 30 years to do something about it?
Like many, I doubt that the results are as dramatically biased as having a “lucky die” that always rolls high (with no evidence to refute that this is indeed the case) in most cases, and I always rotate from a set of three dozen D20s each roll anyway, partly to lessen any such chance.
I’m also not sure what is meant by the “face width” of a triangular face, nor if that is as relevant as the regularity of the triangular shape itself.
I was struck by the clear superiority in uniformity of the measurements of the Gamescience dice from the tables above before repeated applications of statistics flattened the data. I have an engineering background (as in carving metal) and the tolerances of the GS dice are clearly much tighter, which translates quite linearly to the regularity of the polyhedral shape, and lack of oblateness (“sausaging”) overall. If you are driving a car, better hope that someone with LZ’s sensibilities worked the milling machines and lathes.
If tumbled to randomize orientation, then rolled in a straight line along a surface with enough velocity to keep it rolling “long enough” (a scientific term too complex to explain but generally taken to read “until I’m proved right”), an oblate polyhedron like a D20 will eventually orient to the lowest energy configuration – “long” ends horizontal. Funnily enough, a cylinder spun up in microgravity will eventually tumble chaotically, just to be difficult. Funny old universe.
Interesting article. Thanks Matthew.
Neat article.
Now someone get a fist full of Q Workshop dice and get busy! I need to know if they are as unbiased as they are cool to look at.