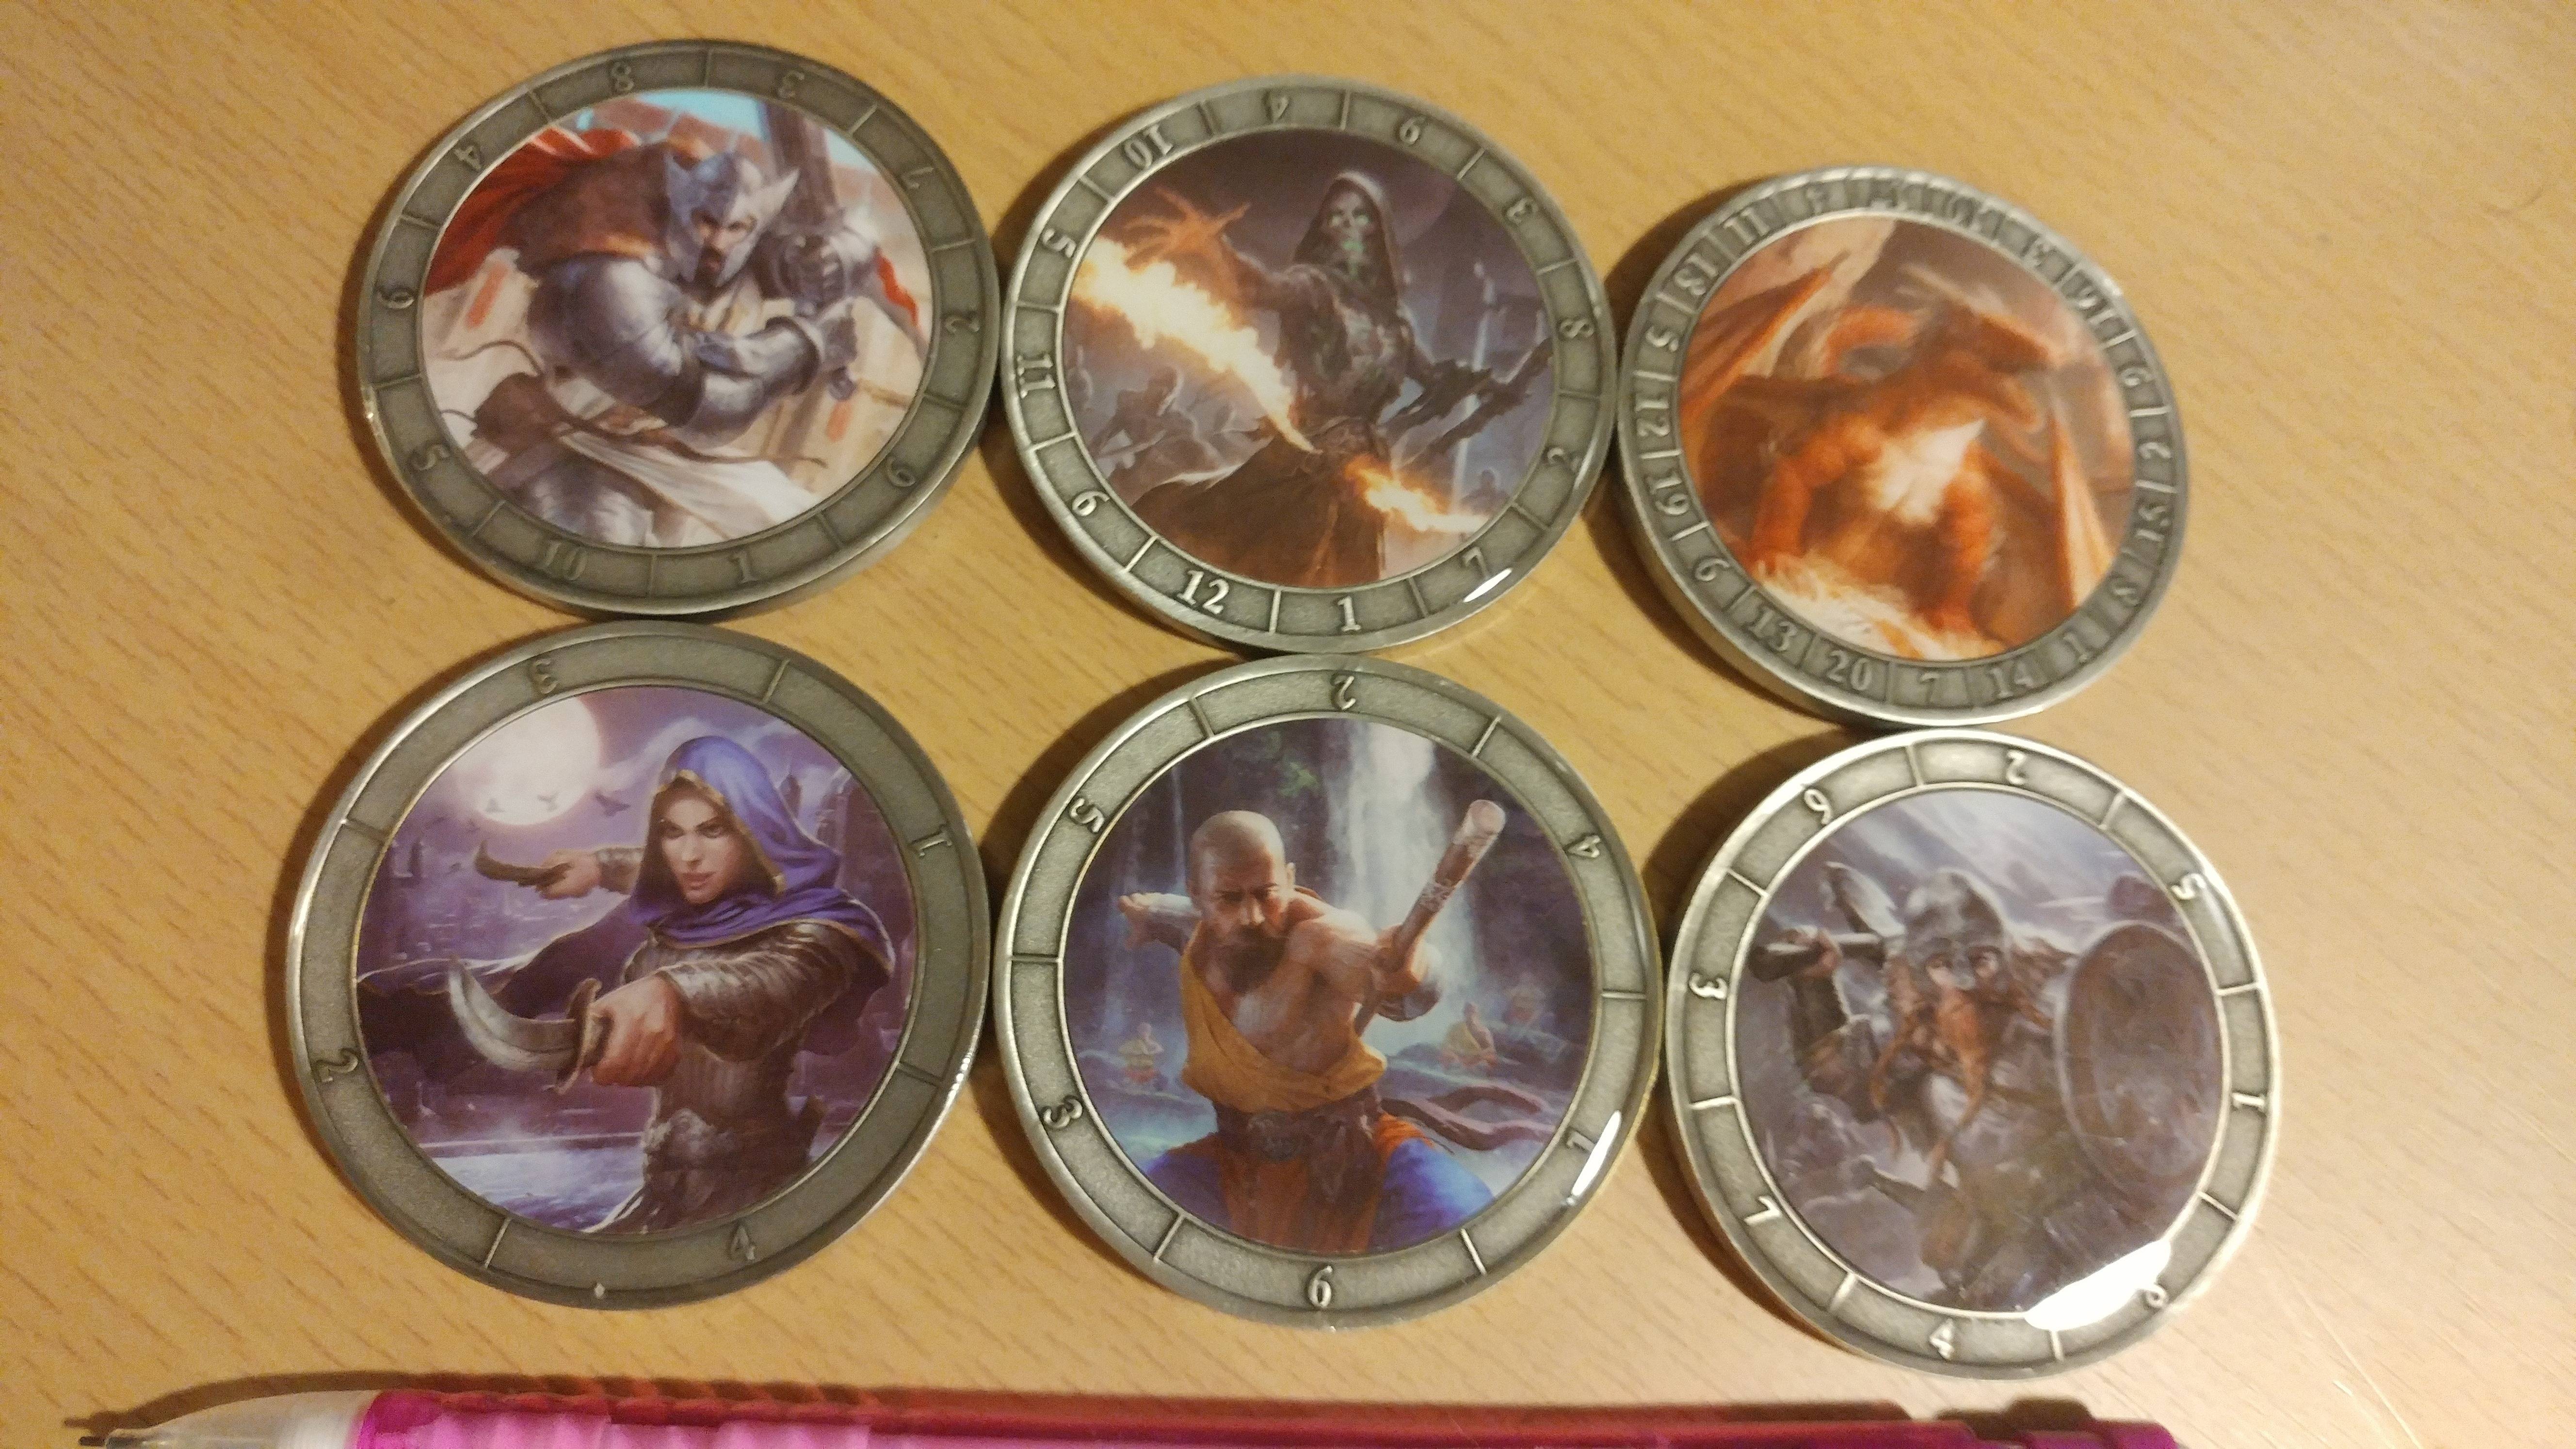
Back when it was active, I was alerted to J. M. Ward’s Kickstarter for Dice Coins. They looked cool, but what piqued my interest was that on the site I saw them mentioned, their statistical fairness was being questioned, and Ward had essentially hand waved it away. In his defense, their fairness makes sense as long as the arc for each number is evenly spaced. I asked for a set of review prototypes to do an analysis, but none were available so I used some of my Patreon loot and backed it. Very quickly after the Kickstarter closed, product was in the mail and had arrived. Most quickly and painlessly fulfilled Kickstarter I have ever backed.
If, after reading the results below, you’d like to snag your own set, Mr. Ward provided the following statement:
“My number one goal was delivering a quality product to my Kickstarter backers on time. Now that I have done that, I will be developing my website for direct sales. In the meantime, customers can e-mail me at ultimatecustomcoins@gmail.com.”
I performed a series of chi square goodness of fit tests to test if the coins produce a reasonable approximation of the ideal uniform distribution for their die type. For each I used a sample of 5 times the number of faces on the die. This is the minimum sample size required to produce a meaningful statistical result. I chose these sample sizes both for ease of testing and because large sample sizes in this case would be overkill. These dice don’t need to exactly match the ideal distribution, they need to approximate it in short play sessions.
English summary result: The results looked very good. All of the dice easily passed a goodness of fit test at any reasonable criteria. Several of the coins were exceptionally close to the ideal distribution.
Stat summary result: p-values for H0: results are from an appropriate uniform distribution ranged from .31 to .96
Long form results:
- Notation:
- df – degrees of freedom, which particular chi square curve we’re comparing against. Depends on the number of sides the die has.
- Chi .05 crit val — the value, for the particular chi square curve we’re looking at, that separates the rarest 5% of groups of rolls from the rest. If the Chi Test Stat exceeds this value, we say the die is not fair. There are other critical values for other tolerances.
- Chi Test Stat — the value we calculated from our rolls. Compared to the critical value.
- p-val — how common the results we observed were. p-values fall between 1 and 0. Closer to 1 is better. Lower than .1, .05, or .01 are usual ground for declaring a deviation from the ideal standard.












The results for the D4 and D8 seem to be skewed by the small number of rolls.
Yes, the minimum criteria for CHI is reached, but 20 rolls is still too little.
This especially in the light of the higher dice (d10,d12,d20) reaching almost 1 with a good number (~100) of rolls.
To some extent, it’s a factor of random sampling. Yes, we got really close to ideal distributions on several dice but we shouldn’t expect to not see any unusual ones. We just hope to not see any ridiculously unusual ones.